Plots the individual prediction explanations.
Usage
# S3 method for class 'shapr'
plot(
  x,
  plot_type = "bar",
  digits = 3,
  print_ggplot = TRUE,
  index_x_explain = NULL,
  top_k_features = NULL,
  col = NULL,
  bar_plot_phi0 = TRUE,
  bar_plot_order = "largest_first",
  scatter_features = NULL,
  scatter_hist = TRUE,
  include_group_feature_means = FALSE,
  beeswarm_cex = 1/length(index_x_explain)^(1/4),
  ...
)
Arguments
- x
An
shaprobject. The output fromexplain().- plot_type
Character. Specifies the type of plot to produce.
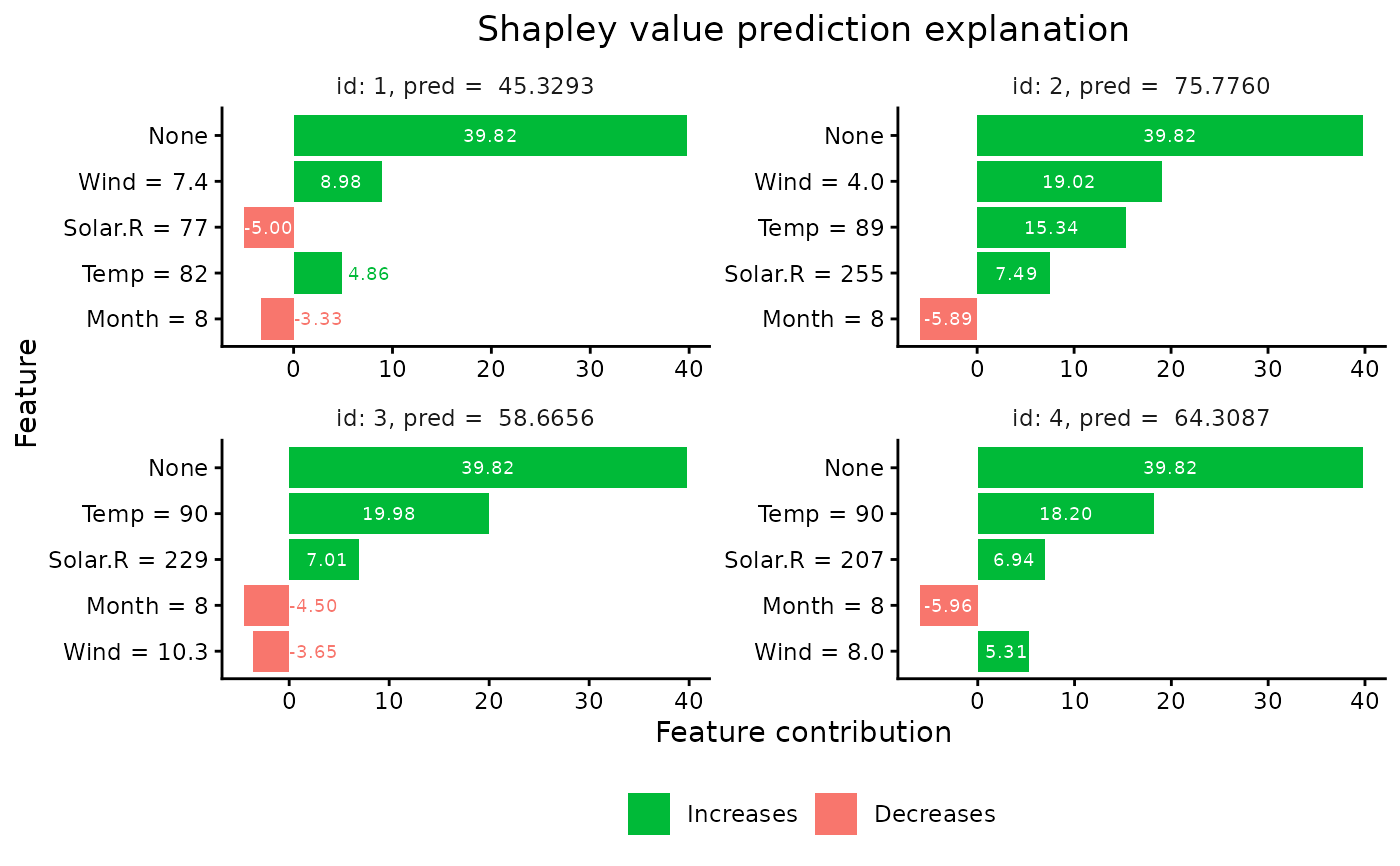
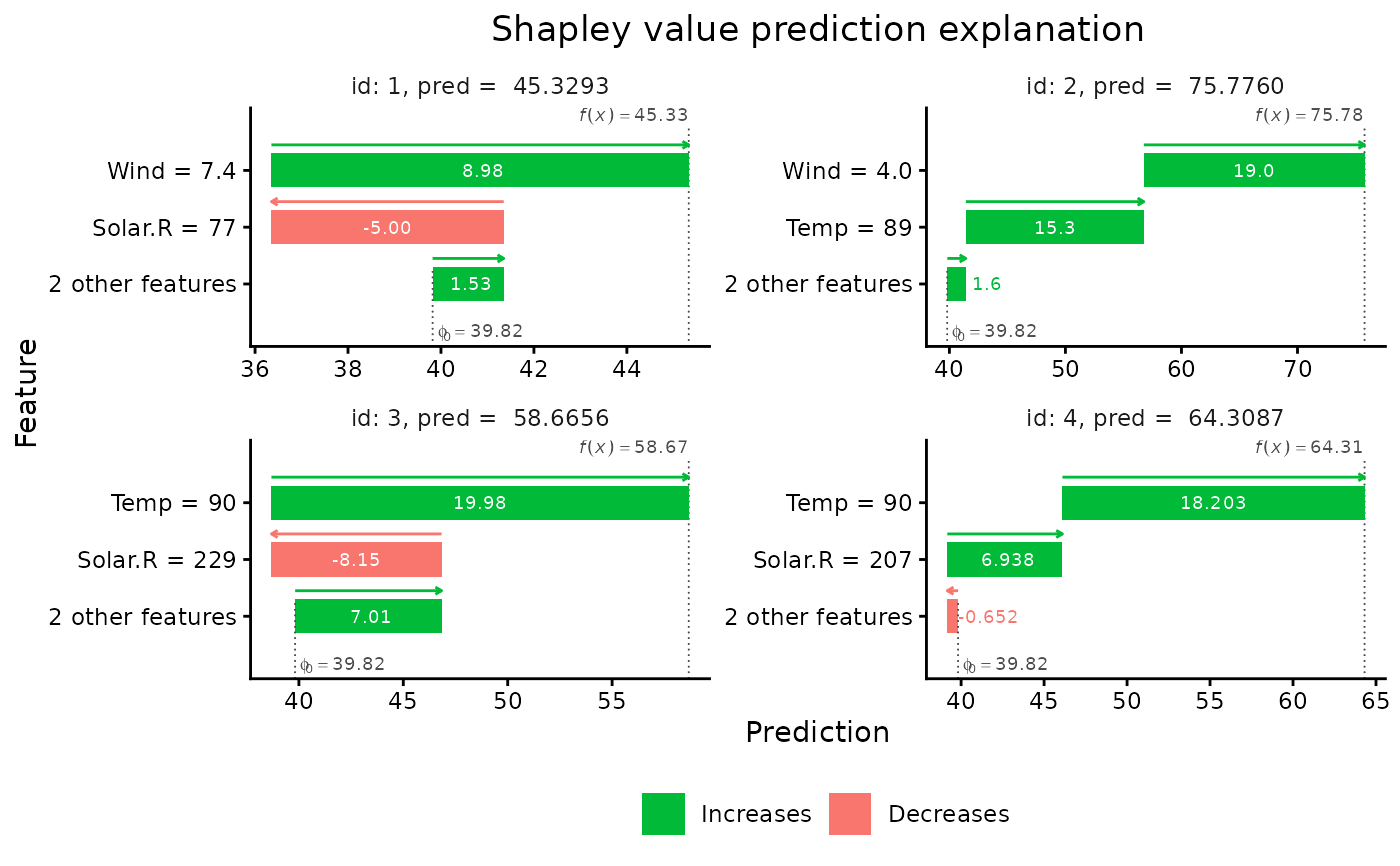
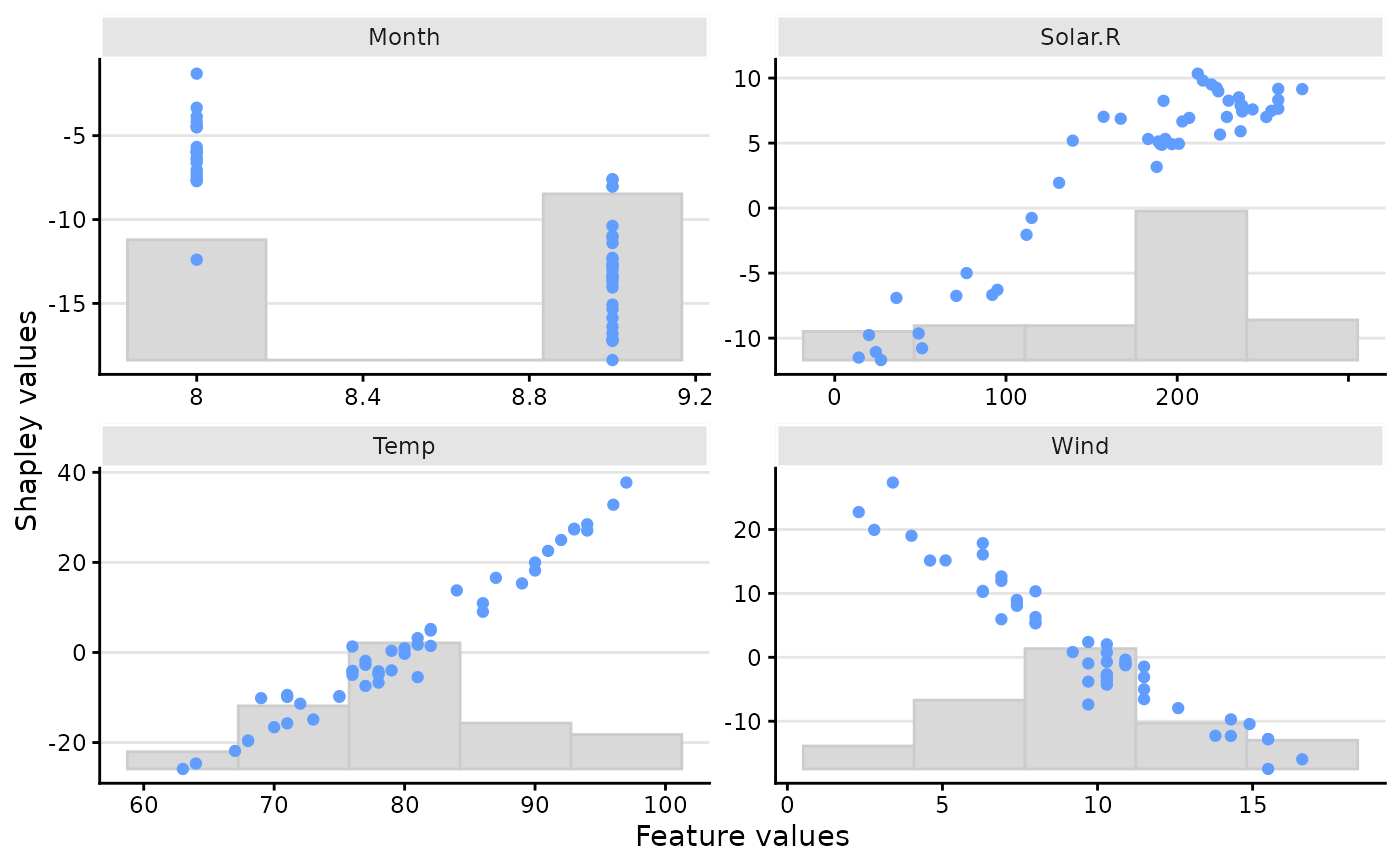
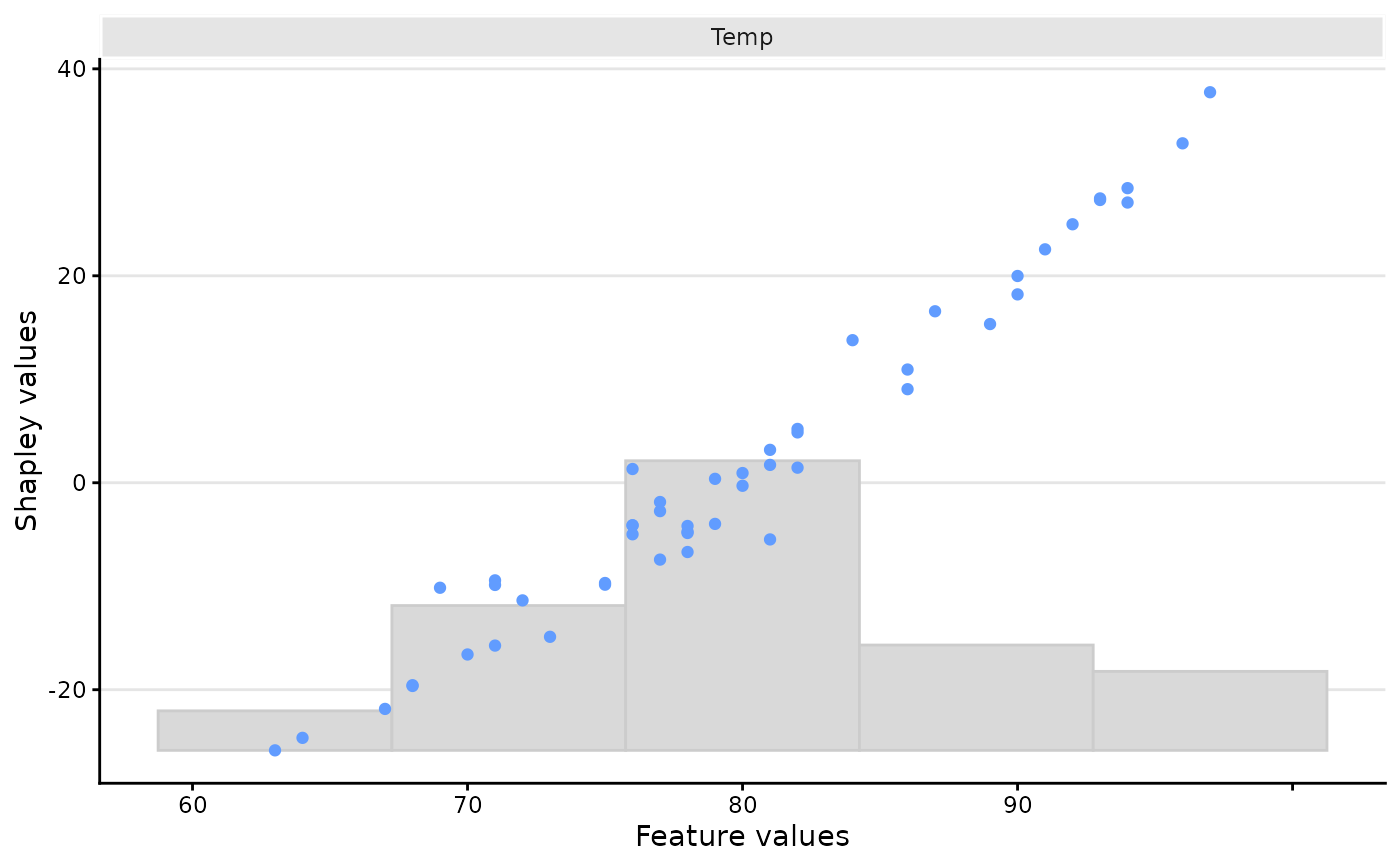
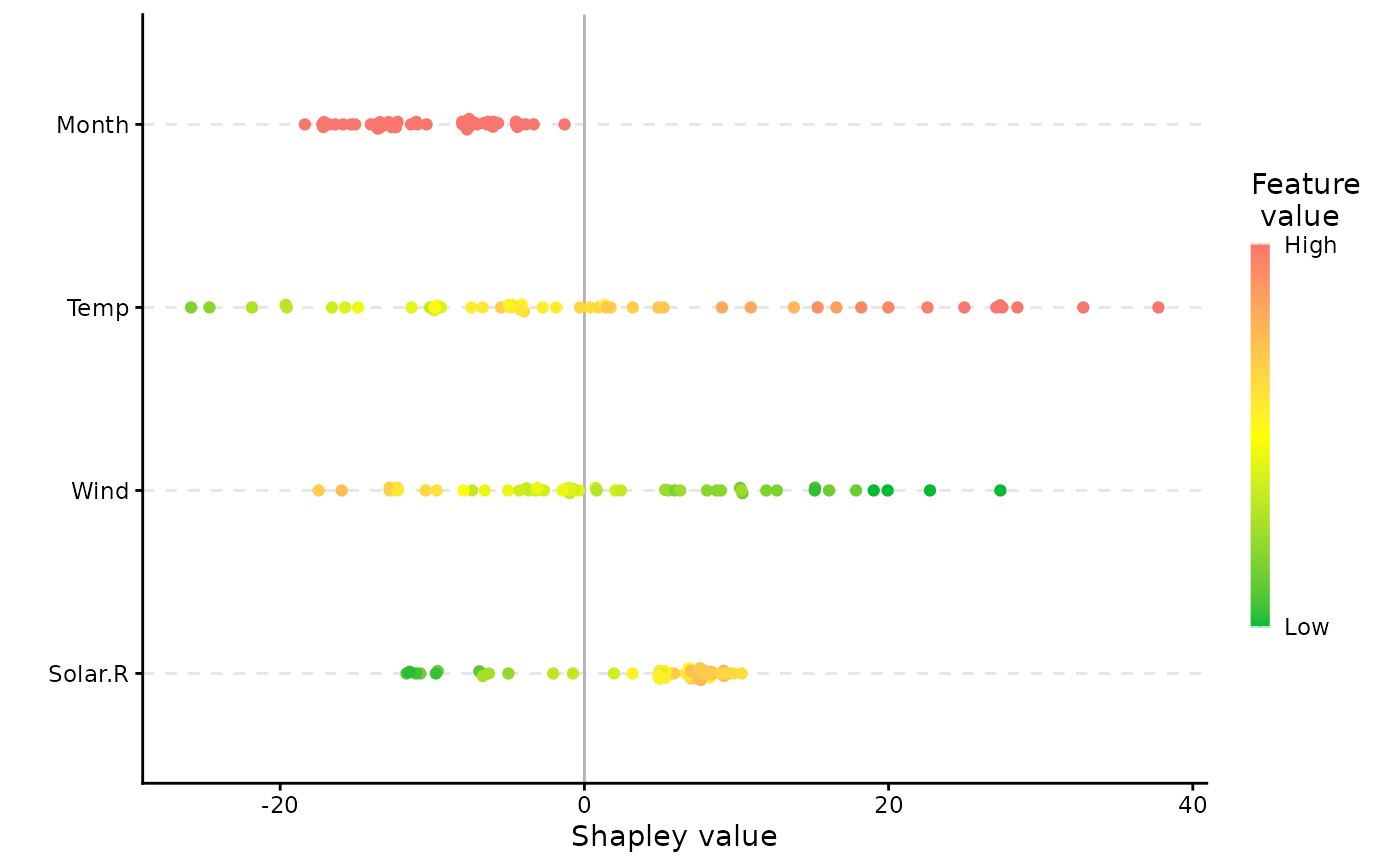
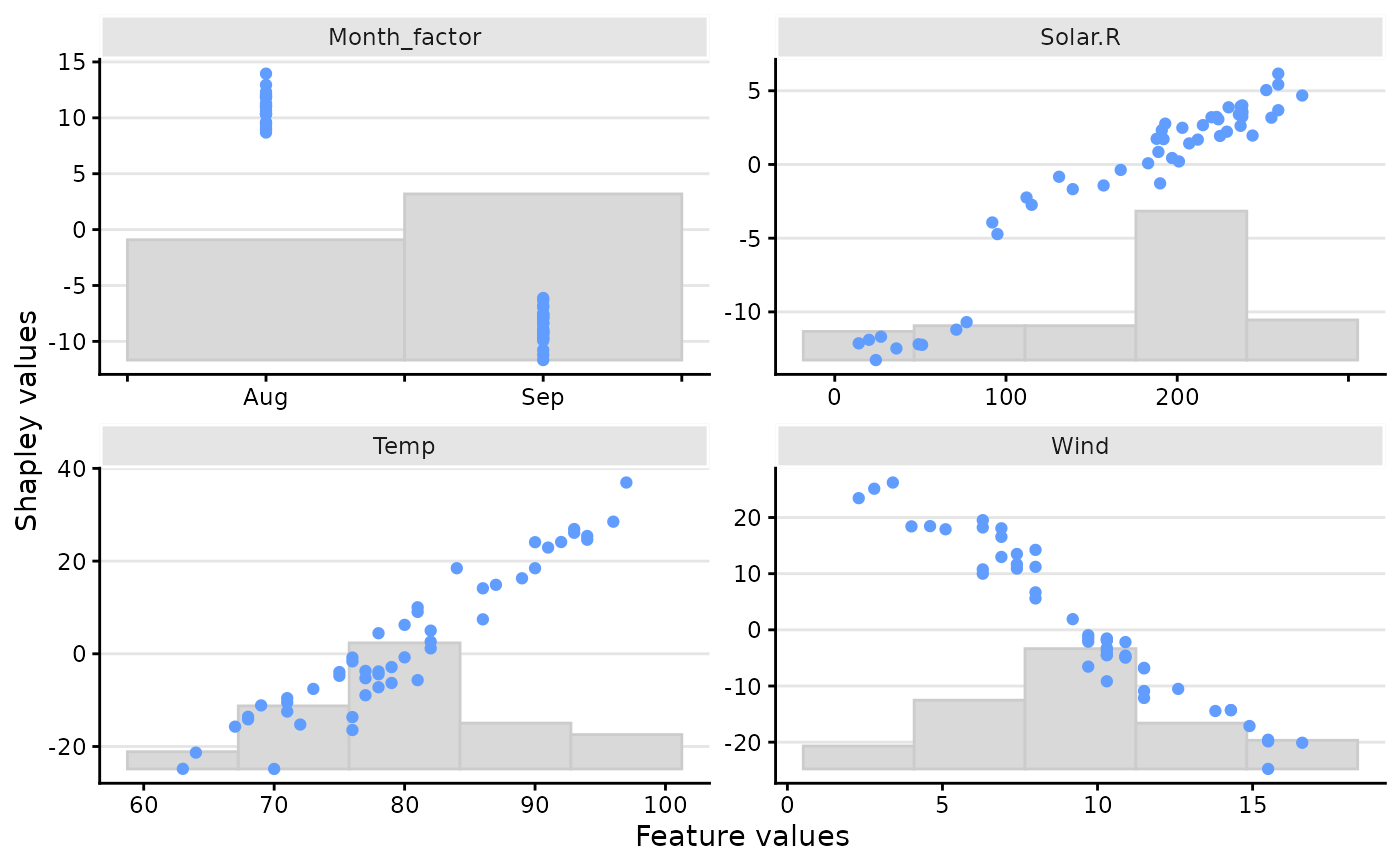
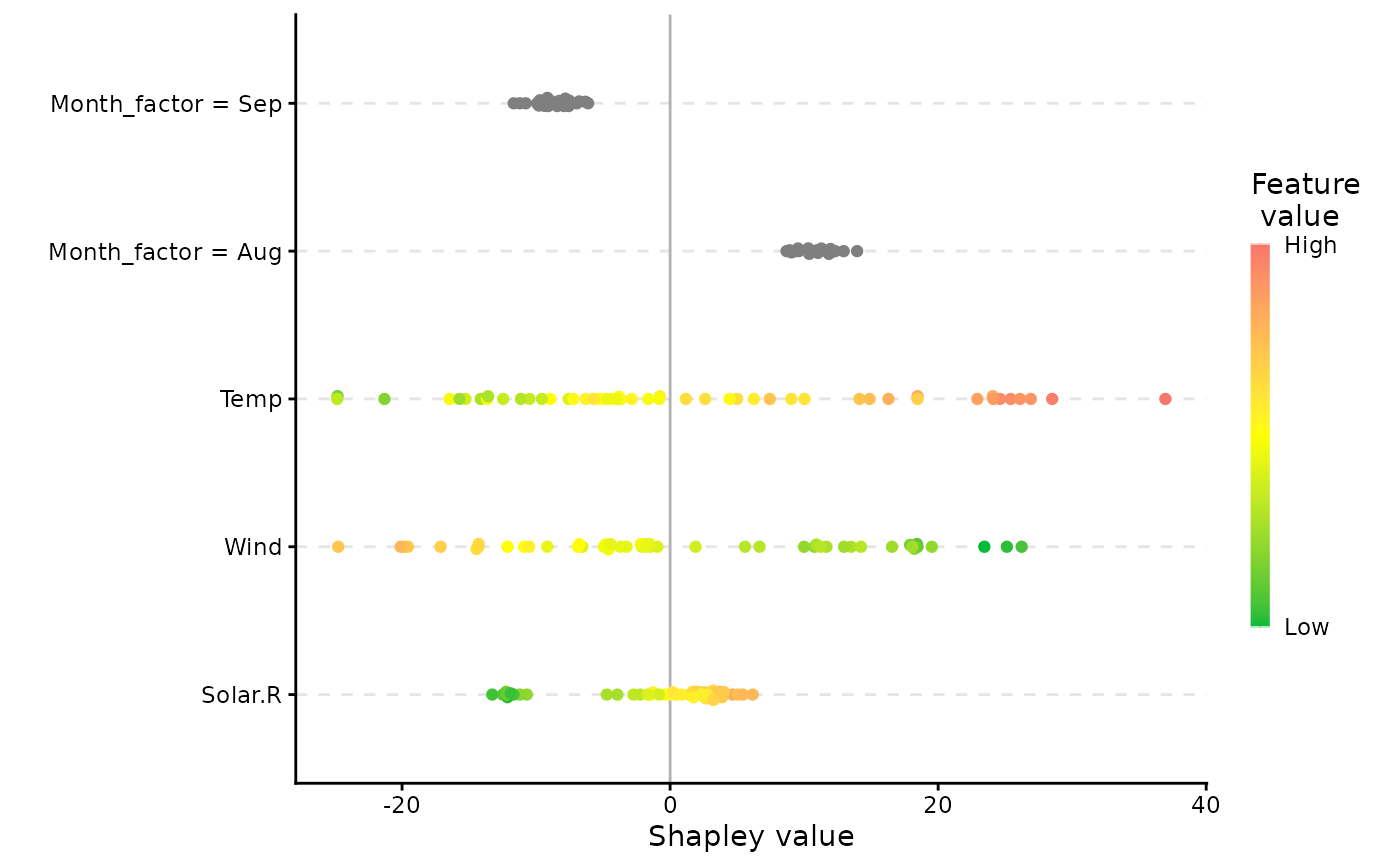
"bar"(the default) gives a regular horizontal bar plot of the Shapley value magnitudes."waterfall"gives a waterfall plot indicating the changes in the prediction score due to each feature's contribution (their Shapley values)."scatter"plots the feature values on the x-axis and Shapley values on the y-axis, as well as (optionally) a background scatter_hist showing the distribution of the feature data."beeswarm"summarizes the distribution of the Shapley values along the x-axis for all the features. Each point gives the Shapley value of a given instance, where the points are colored by the feature value of that instance. For SAGE values (scope = "global"inexplain()), only"bar"and"waterfall"are supported, as SAGE produces a single global loss-based explanation rather than per-observation prediction explanations.- digits
Integer. Number of significant digits to use in the feature description. Applicable for
plot_type"bar"and"waterfall"- print_ggplot
Logical. Whether to print the created
ggplotobject once it is returned. The default isTRUEwhich ensures the plot is always displayed also in loops, functions, when sourcing a script, and when assigning the output to a variable likep <- plot.shapr(...). Seeggplot2::print.ggplot()for more details. If you wish to further modify the returnedggplotobject outside ofplot.shapr, we recommend settingprint_ggplot = FALSEto avoid force printing. See the examples for a practical use case.- index_x_explain
Integer vector. Which of the test observations to plot. For example, if you have explained 10 observations using
explain(), you can generate a plot for the first five observations by settingindex_x_explain = 1:5. Defaults to the first 10 observations forplot_type = "bar"and"waterfall", and to all observations forplot_type = "scatter"and"beeswarm".- top_k_features
Integer. How many features to include in the plot. E.g. if you have 15 features in your model you can plot the 5 most important features, for each explanation, by setting
top_k_features = 1:5. Applicable forplot_type"bar"and"waterfall"- col
Character vector (where length depends on plot type). The color codes (hex codes or other names understood by
ggplot2::ggplot()) for positive and negative Shapley values, respectively. The default iscol=NULL, plotting with the default colors respective to the plot type. Forplot_type = "bar"andplot_type = "waterfall", the default isc("#00BA38","#F8766D"). Forplot_type = "beeswarm", the default isc("#F8766D","yellow","#00BA38"). Forplot_type = "scatter", the default is"#619CFF".If you want to alter the colors in the plot, the length of the
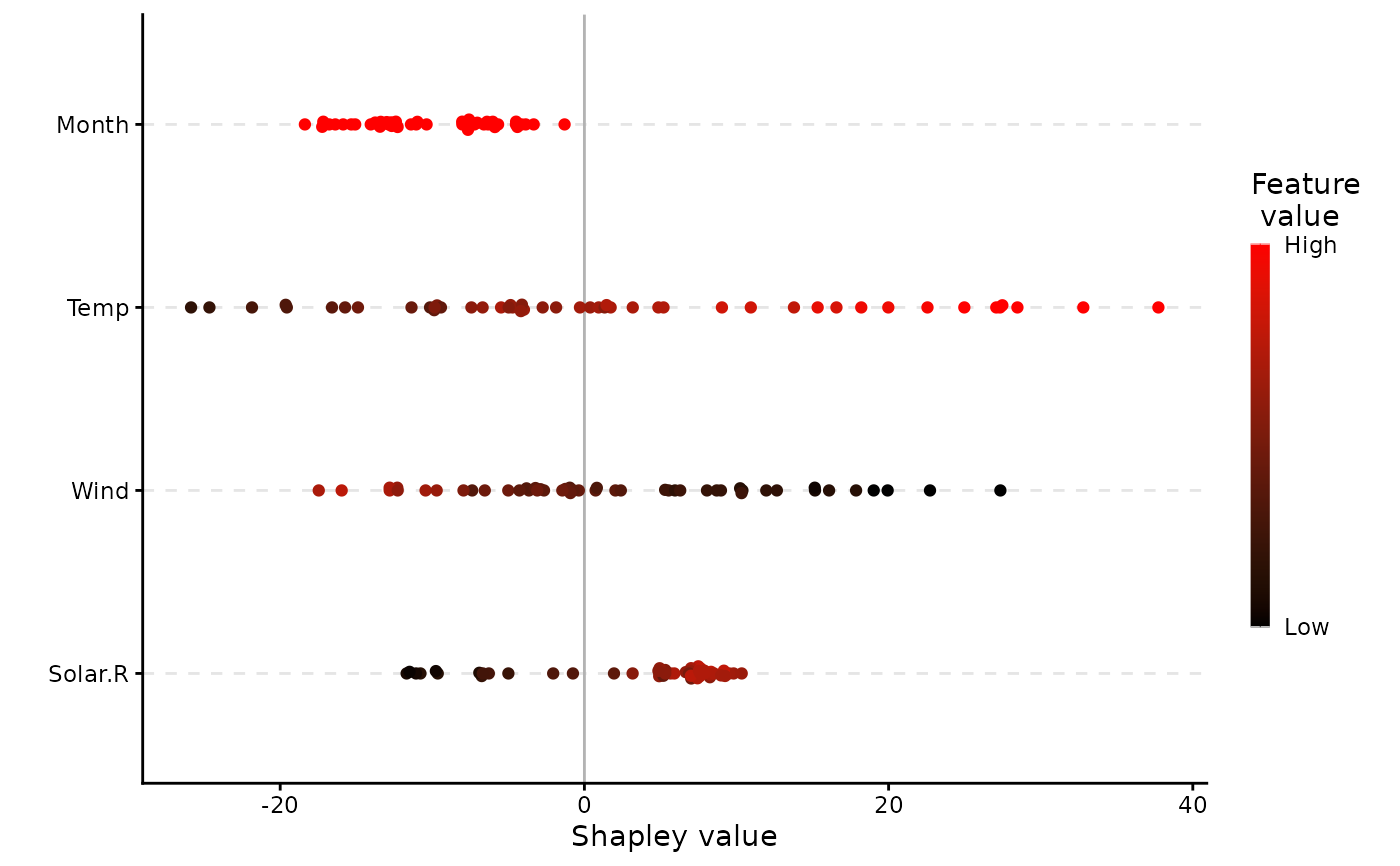
colvector depends on plot type. Forplot_type = "bar"orplot_type = "waterfall", two colors should be provided, first for positive and then for negative Shapley values. Forplot_type = "beeswarm", either two or three colors can be given. If two colors are given, then the first color determines the color that points with high feature values will have, and the second determines the color of points with low feature values. If three colors are given, then the first colors high feature values, the second colors mid-range feature values, and the third colors low feature values. For instance,col = c("red", "yellow", "blue")will make high values red, mid-range values yellow, and low values blue. Forplot_type = "scatter", a single color is to be given, which determines the color of the points on the scatter plot.- bar_plot_phi0
Logical. Whether to include
phi0in the plot forplot_type = "bar".- bar_plot_order
Character. Specifies what order to plot the features with respect to the magnitude of the Shapley values with
plot_type = "bar":"largest_first"(the default) plots the features ordered from largest to smallest absolute Shapley value."smallest_first"plots the features ordered from smallest to largest absolute Shapley value."original"plots the features in the original order of the data table.- scatter_features
Integer or character vector. Only used for
plot_type = "scatter". Specifies which features to include in the scatter plot. Can be a numerical vector indicating feature index, or a character vector, indicating the name(s) of the feature(s) to plot.- scatter_hist
Logical. Only used for
plot_type = "scatter". Whether to include a scatter_hist indicating the distribution of the data when making the scatter plot. Note that the bins are scaled so that when all the bins are stacked they fit the span of the y-axis of the plot.- include_group_feature_means
Logical. Whether to include the average feature value in a group on the y-axis or not. If
FALSE(default), then no value is shown for the groups. IfTRUE, thenshaprincludes the mean of the features in each group.- beeswarm_cex
Numeric. The cex argument of
ggbeeswarm::geom_beeswarm(), controlling the spacing in the beeswarm plots.- ...
Other arguments passed to underlying functions, like
ggbeeswarm::geom_beeswarm()forplot_type = "beeswarm".
Details
See the examples below, or vignette("general_usage", package = "shapr") for examples of
how to use the function.
Examples
# \donttest{
if (requireNamespace("party", quietly = TRUE)) {
data("airquality")
airquality <- airquality[complete.cases(airquality), ]
x_var <- c("Solar.R", "Wind", "Temp", "Month")
y_var <- "Ozone"
# Split data into test- and training data
data_train <- head(airquality, -50)
data_explain <- tail(airquality, 50)
x_train <- data_train[, x_var]
x_explain <- data_explain[, x_var]
# Fit a linear model
lm_formula <- as.formula(paste0(y_var, " ~ ", paste0(x_var, collapse = " + ")))
model <- lm(lm_formula, data = data_train)
# Explain predictions
p <- mean(data_train[, y_var])
# Empirical approach
x <- explain(
model = model,
x_explain = x_explain,
x_train = x_train,
approach = "empirical",
phi0 = p,
n_MC_samples = 1e2
)
if (requireNamespace(c("ggplot2", "ggbeeswarm"), quietly = TRUE)) {
# The default plotting option is a bar plot of the Shapley values
# We draw bar plots for the first 4 observations
plot(x, index_x_explain = 1:4)
# We can also make waterfall plots
plot(x, plot_type = "waterfall", index_x_explain = 1:4)
# And only showing the two features with the largest contributions
plot(x, plot_type = "waterfall", index_x_explain = 1:4, top_k_features = 2)
# Or scatter plots showing the distribution of the Shapley values and feature values
plot(x, plot_type = "scatter")
# And only for a specific feature
plot(x, plot_type = "scatter", scatter_features = "Temp")
# Or a beeswarm plot summarising the Shapley values and feature values for all features
plot(x, plot_type = "beeswarm")
plot(x, plot_type = "beeswarm", col = c("red", "black")) # we can change colors
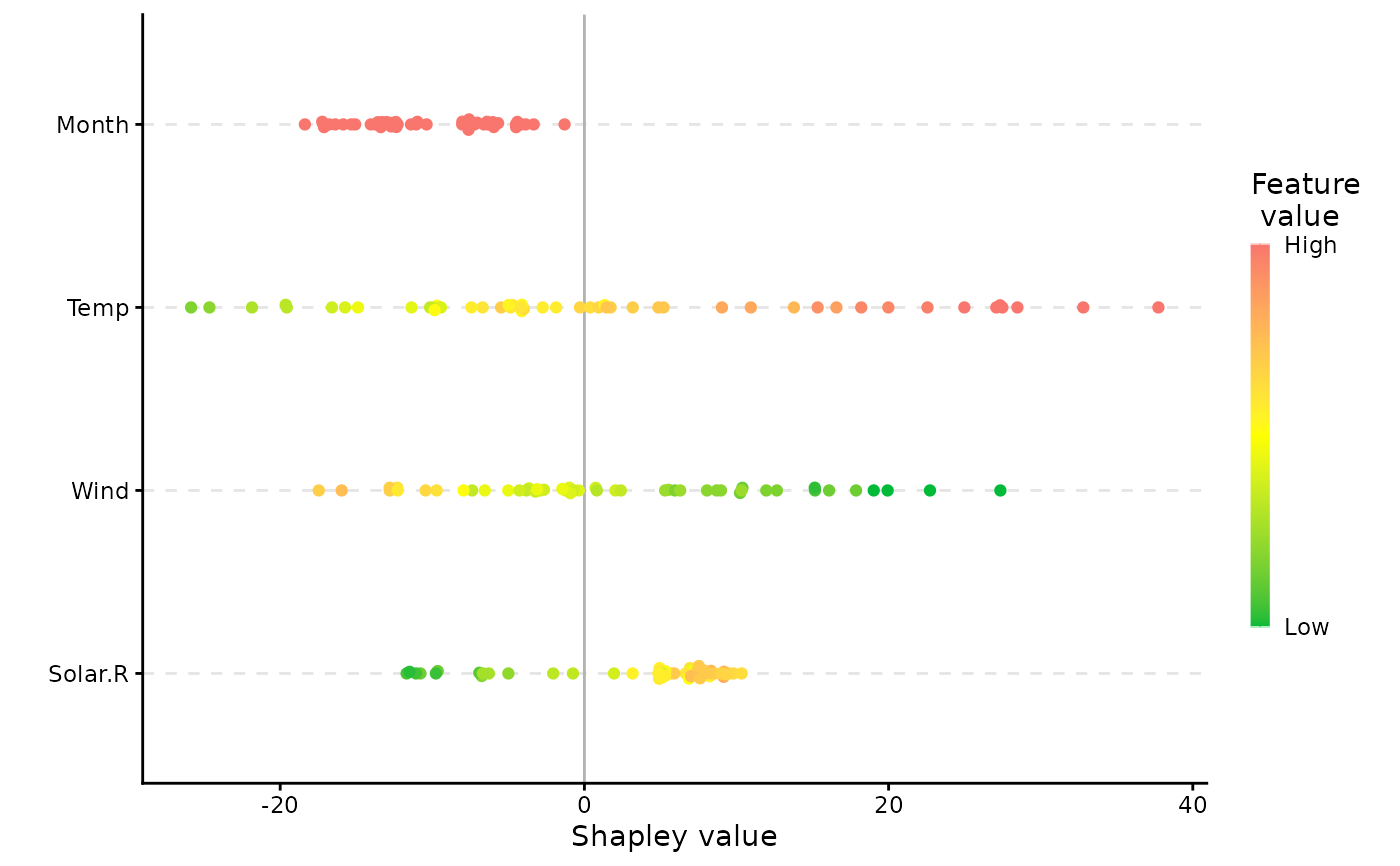
# Additional arguments can be passed to ggbeeswarm::geom_beeswarm() using the '...' argument.
# For instance, sometimes the beeswarm plots overlap too much.
# This can be fixed with the 'corral="wrap" argument.
# See ?ggbeeswarm::geom_beeswarm for more information.
plot(x, plot_type = "beeswarm", corral = "wrap")
}
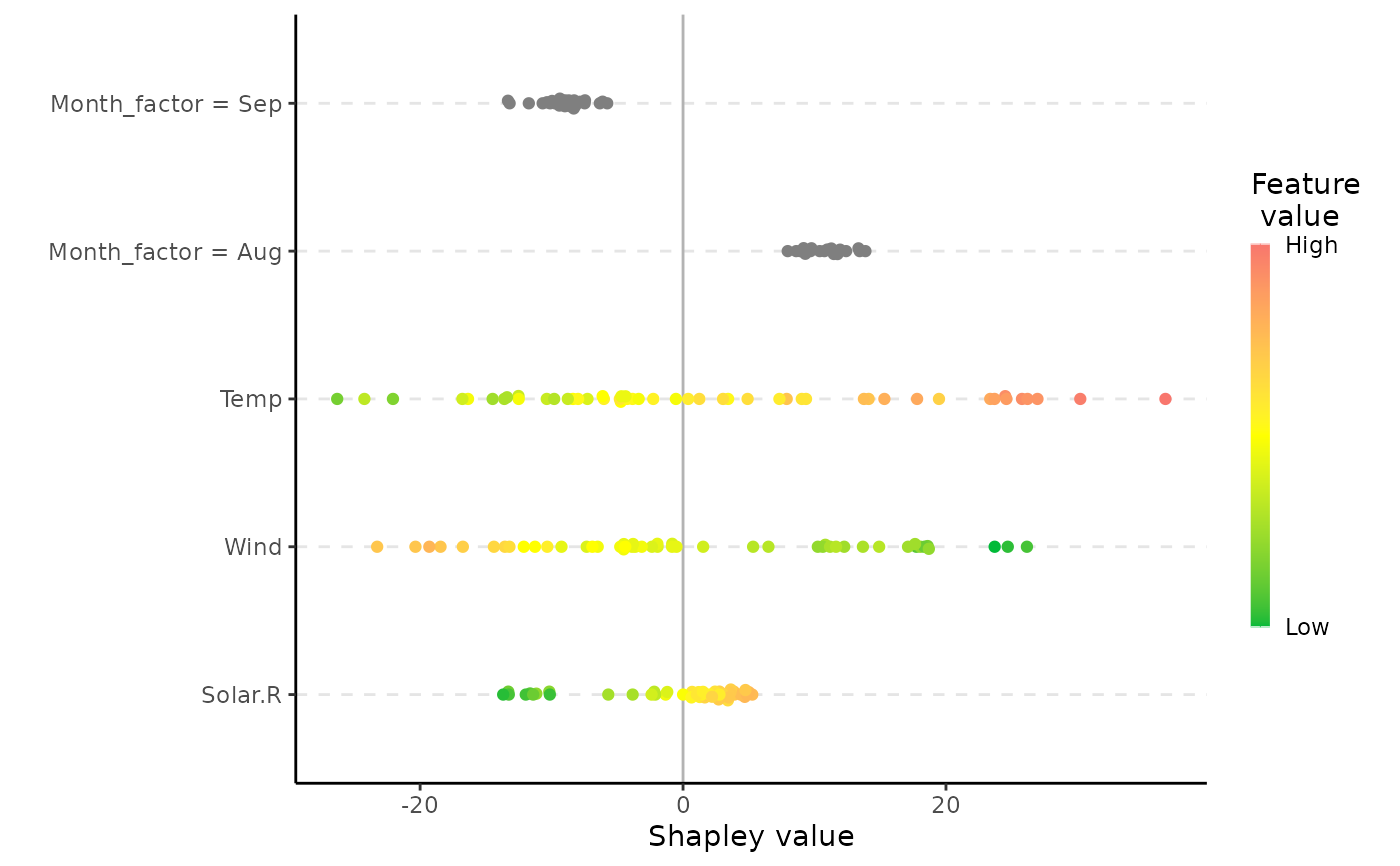
# Example of scatter and beeswarm plot with factor variables
airquality$Month_factor <- as.factor(month.abb[airquality$Month])
airquality <- airquality[complete.cases(airquality), ]
x_var <- c("Solar.R", "Wind", "Temp", "Month_factor")
y_var <- "Ozone"
# Split data into test- and training data
data_train <- airquality
data_explain <- tail(airquality, 50)
x_train <- data_train[, x_var]
x_explain <- data_explain[, x_var]
# Fit a linear model
lm_formula <- as.formula(paste0(y_var, " ~ ", paste0(x_var, collapse = " + ")))
model <- lm(lm_formula, data = data_train)
# Explain predictions
p <- mean(data_train[, y_var])
# Empirical approach
x <- explain(
model = model,
x_explain = x_explain,
x_train = x_train,
approach = "ctree",
phi0 = p,
n_MC_samples = 1e2
)
if (requireNamespace(c("ggplot2", "ggbeeswarm"), quietly = TRUE)) {
plot(x, plot_type = "scatter")
plot(x, plot_type = "beeswarm")
}
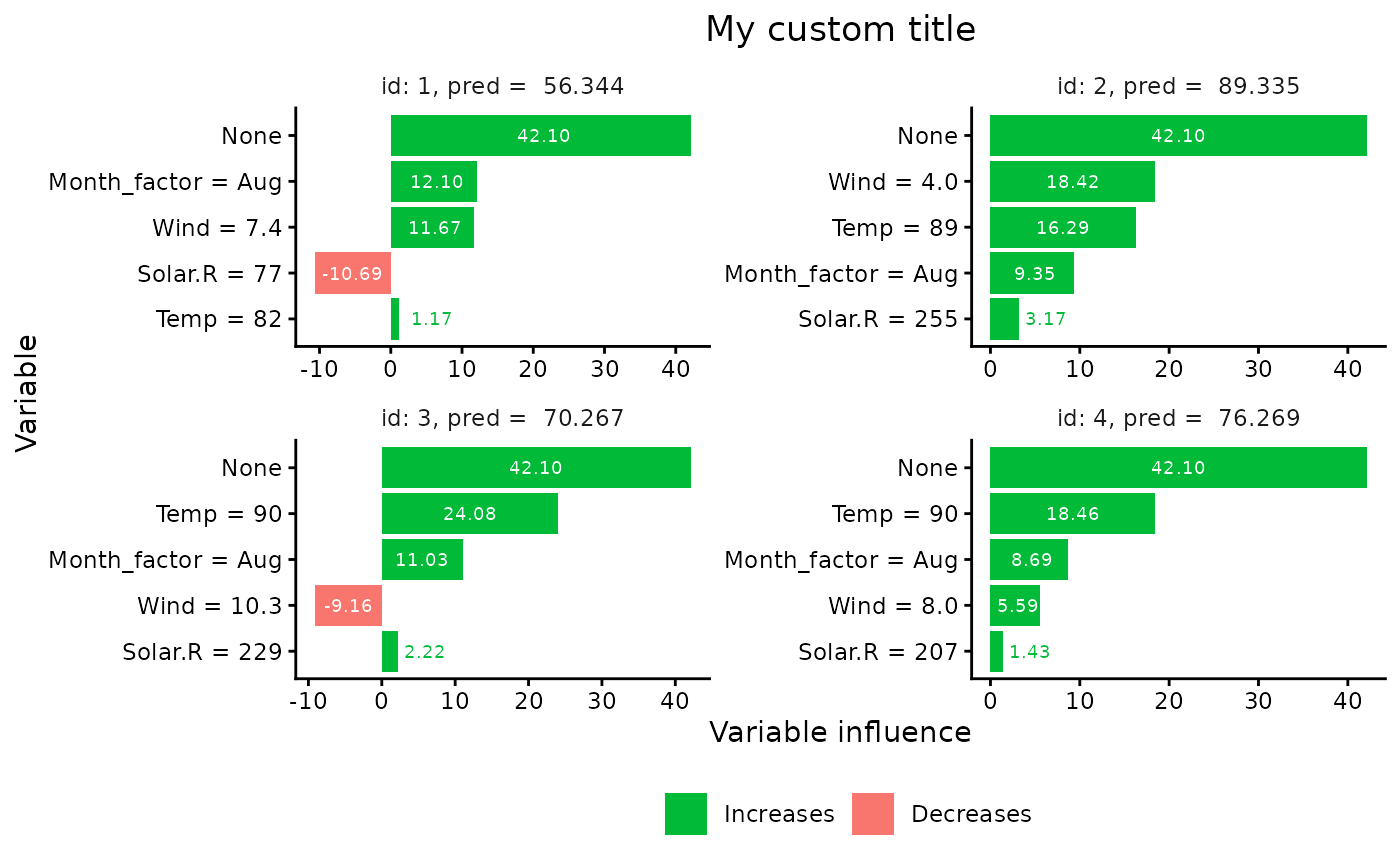
# Example of further modification of the output from plot.shapr
plt <- plot(x, index_x_explain = 1:4, print_ggplot = FALSE) # Storing without printing
# Displays the modified ggplot object
plt +
ggplot2::ggtitle("My custom title") +
ggplot2::ylab("Variable influence") +
ggplot2::xlab("Variable")
}
#>
#> ── Starting `shapr::explain()` at 2026-07-15 21:25:45 ──────────────────────────
#> ℹ `max_n_coalitions` is `NULL` or larger than `2^n_features = 16`, and is
#> therefore set to `2^n_features = 16`.
#>
#> ── Explanation overview ──
#>
#> • Model class: <lm>
#> • v(S) estimation class: Monte Carlo integration
#> • Approach: empirical
#> • Procedure: Non-iterative
#> • Number of Monte Carlo integration samples: 100
#> • Number of feature-wise Shapley values: 4
#> • Number of observations to explain: 50
#> • Computations (temporary) saved at: /tmp/Rtmplxfwsh/shapr_obj_24694e70e622.rds
#>
#> ── Main computation started ──
#>
#> ℹ Using 16 of 16 coalitions.
#> ℹ Coalitions split into 10 batches (mean 1.6 per batch).
 #>
#> ── Starting `shapr::explain()` at 2026-07-15 21:25:56 ──────────────────────────
#> ℹ `max_n_coalitions` is `NULL` or larger than `2^n_features = 16`, and is
#> therefore set to `2^n_features = 16`.
#>
#> ── Explanation overview ──
#>
#> • Model class: <lm>
#> • v(S) estimation class: Monte Carlo integration
#> • Approach: ctree
#> • Procedure: Non-iterative
#> • Number of Monte Carlo integration samples: 100
#> • Number of feature-wise Shapley values: 4
#> • Number of observations to explain: 50
#> • Computations (temporary) saved at: /tmp/Rtmplxfwsh/shapr_obj_2469781fe87b.rds
#>
#> ── Main computation started ──
#>
#> ℹ Using 16 of 16 coalitions.
#> ℹ Coalitions split into 10 batches (mean 1.6 per batch).
#>
#> ── Starting `shapr::explain()` at 2026-07-15 21:25:56 ──────────────────────────
#> ℹ `max_n_coalitions` is `NULL` or larger than `2^n_features = 16`, and is
#> therefore set to `2^n_features = 16`.
#>
#> ── Explanation overview ──
#>
#> • Model class: <lm>
#> • v(S) estimation class: Monte Carlo integration
#> • Approach: ctree
#> • Procedure: Non-iterative
#> • Number of Monte Carlo integration samples: 100
#> • Number of feature-wise Shapley values: 4
#> • Number of observations to explain: 50
#> • Computations (temporary) saved at: /tmp/Rtmplxfwsh/shapr_obj_2469781fe87b.rds
#>
#> ── Main computation started ──
#>
#> ℹ Using 16 of 16 coalitions.
#> ℹ Coalitions split into 10 batches (mean 1.6 per batch).
 # }
# }